Danbooru
Login Posts Comments Notes Artists Tags Pools Wiki Forum More »
Search Changes Help
  • |
  • Posts (494) History

    Blacklisted (help)

    • guro
    • scat
    • furry -rating:g
    Disable all Re-enable all

    Recent Changes (all)

    • karasawa aisa
    • amanogawa yuki
    • lily subaru
    • new ~maid-san no gakkou~
    • izue shinobu
    • list of honkai: star rail characters
    • tsumaki natsumi
    • purrloin
    • kurumatani keine
    • two-finger handjob
    • red gundam
    • sekino youko
    • ishigami mio
    • list of genshin impact characters
    • kudou sakua
    • takeda mimi
    • takegoshi chihana
    • noroi usagi
    • seliph (fire emblem)
    • uchida mayuri
    • sakuragawa megu
    • udagawa ako
    • unlikely accident
    • toyama asuka
    • kurata mashiro

    Options

    • Tag History
    • Post History
    • Wiki History
    • Discussions
    • What Links Here
    • Mistagged Posts
    • Untagged Posts

    graph

    図表

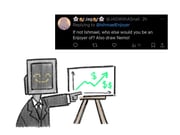
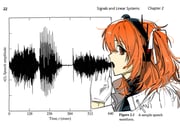
    A graph is a visualization of numerical data. Examples include line graphs, scatter plots, bar charts, radar charts, pie charts etc.

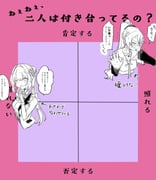
    When a graph makes use of two or three axis at right angles to one another (often with a grid), it is a Cartesian chart. Line graphs and scatter plots are examples of these.

    Not to be confused with chart, which is generally for comparison charts between characters.

    Examples

    Bar chart
    Pie chart

    See also

    • chart
    • diagram
    • bar chart
    • pie chart
    • radar chart
    • stock chart
    • cartesian chart
    • stats
    • gauge
    • urine meter
    • presentation
    • Tag group:Image composition

    The following tags are aliased to this tag: graph_(object) (learn more).

    The following tags implicate this tag: bar_chart, pie_chart, and radar_chart (learn more).

    Posts

    post #9481382
    post #9457793
    post #9451005
    post #9443997
    post #9439916
    post #9403856
    post #9390006
    Terms / Privacy / Upgrade / Contact /